Find the enrollment story hiding in public data
Use plain English to explore enrollment trends, financial health, peer benchmarking, market shifts, and institutional risk across 4,000+ U.S. institutions
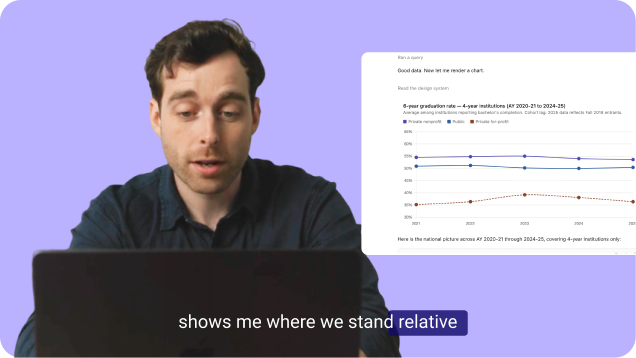
Click any question to copy it, then paste it into the demo above.
Competitive market
Know who is growing in your market and why
See which institutions near you are gaining students, what they share, and where your strongest programs face real pressure.
⚡
Competitive risk
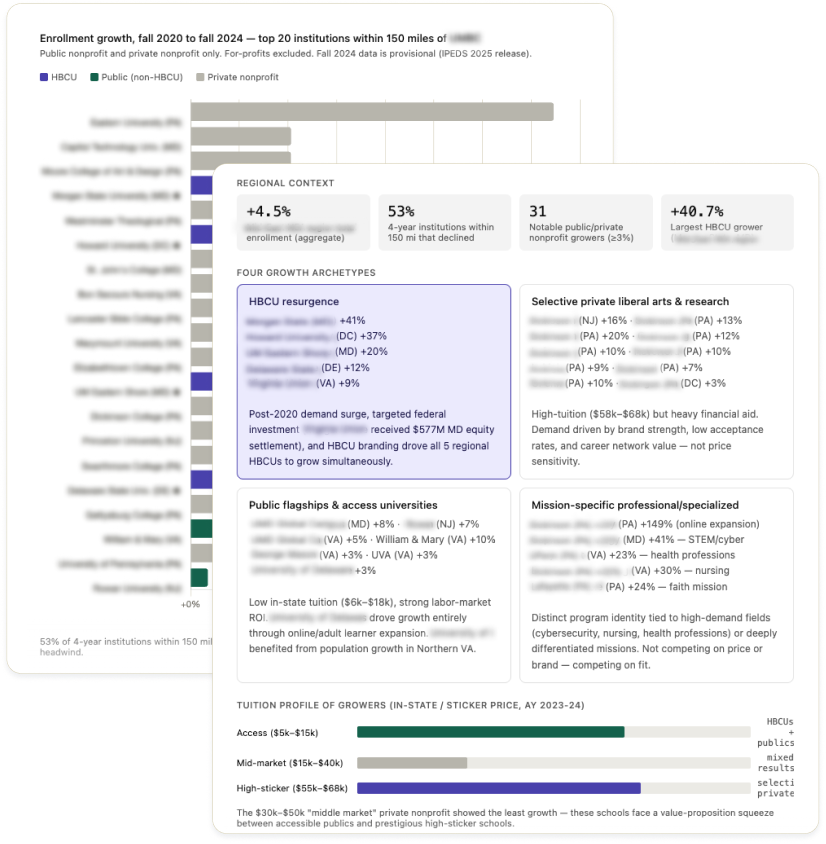
Which institutions in our competitive market are growing despite regional headwinds, and what do they have in common?
🗺️
Program openings
Which of our strongest programs are in areas where competitor enrollment has pulled back since 2020?
🔗
Market gaps
Which program areas in our competitive market have few strong players — and are those areas growing or stable?
🧭
Market consolidation
How might the competitive landscape in our region consolidate over the next decade, based on current enrollment and financial trajectories?
Net price strategy
See what peers charge and what the market will bear
Compare your net price to peer institutions, see which ones raised price without losing enrollment, and find where demand appears to have a ceiling.
💰
Pricing
Among peer institutions that grew enrollment, what net price are they charging, and how does ours compare?

🏷️
Price gap
How has our net price gap relative to peer institutions changed over the past 5 years?
📈
Price resilience
Which peer institutions raised net price without losing enrollment, and what else changed at those schools?
📉
Price threshold
At what net price level does enrollment growth tend to stall among institutions like ours?
Completion and equity
See who finishes and where your outcomes stand
Benchmark graduation and transfer-out rates against similar institutions, and see where peers have closed equity gaps you haven't yet.
🎓
Retention
How does our 6-year graduation rate compare to institutions with a similar Pell share and price point?

⬆️
Completion gains
Which institutions like ours have improved 6-year graduation rates the most, and what changed at those schools?
💡
Aid and persistence
Is there a pattern between net price generosity and retention rate across our peer institutions?
🎯
Equity gap
How does our Pell student graduation rate compare to institutions with similar access profiles?
Regional enrollment share
See where you are gaining ground and where you are not
Measure your share of regional and state demand year by year, see which institutions are gaining at your expense, and find the student segments where you are ahead or falling behind.
📊
Market share
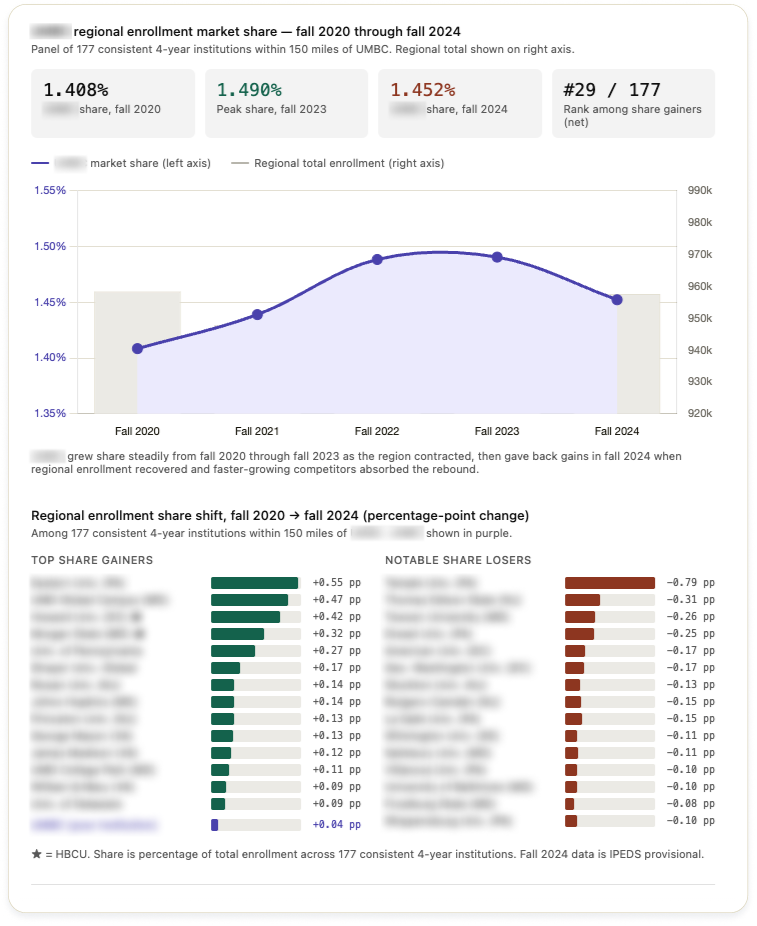
Is our share of regional degree-seeking enrollment growing or shrinking, and who is capturing the students we're not?
🏛️
State competition
Which public institutions in our state are gaining enrollment share — in which programs and geographies?
🌱
Growth segments
Are we growing in any enrollment segments where total market demand is also increasing?
🏙️
Program competition
Which nearby institutions are expanding into program areas where we already have enrollment strength?
See what your enrollment team can do
Get a custom demo